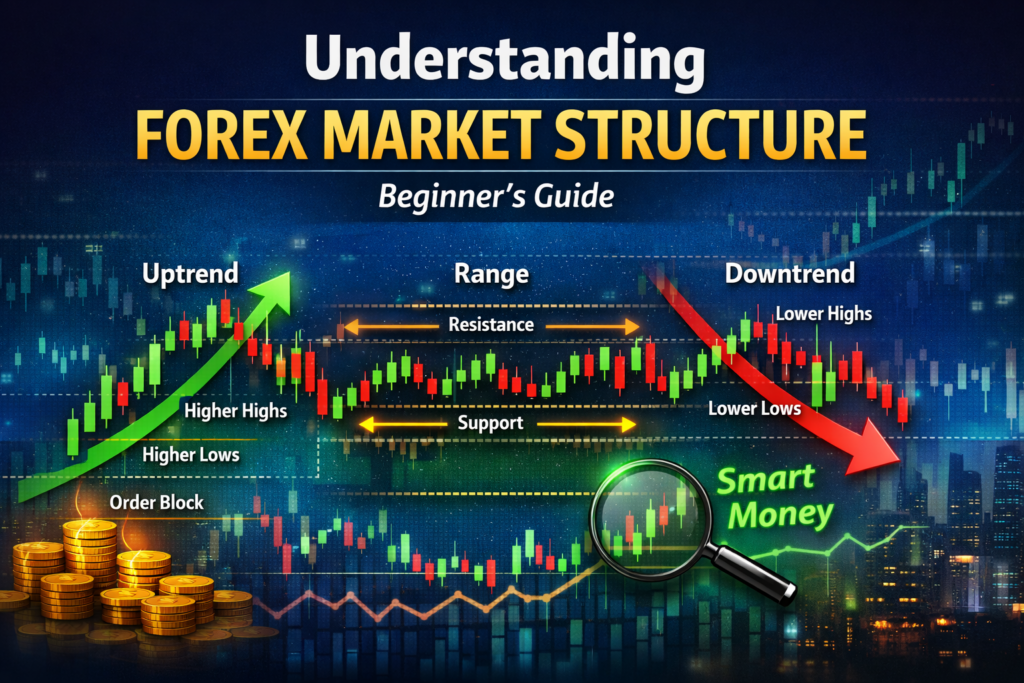
The Complete Beginner’s Guide to Forex Market Structure. Understanding Forex Market Structure (Beginner’s Guide)
Market structure is the foundation of technical analysis. Before indicators, before strategies, before entries — you must understand how price moves. If you can read market structure, you can read the market’s intentions.
More importantly, mastering market structure is your primary defense against blowing a funded prop firm account. Most traders fail evaluations not because of a bad edge, but because they violate strict daily drawdown limits by trading against the prevailing trend or falling for retail stop-hunts.
This guide breaks down forex market structure in a simple, practical way so you can apply it immediately to your personal charts or your next Prop Firm Match Assessment.
What Market Structure Actually Means in Forex
Market structure is the natural pattern price creates as it moves. It’s built from:
- Swing highs
- Swing lows
- Breaks of structure (BOS)
- Changes of character (CHOCH)
Swing Highs & Swing Lows
- A swing high forms when price pushes up, stalls, and reverses.
- A swing low forms when price pushes down, stalls, and reverses.
These swings create the structural “skeleton” of the market.
Break of Structure (BOS)
A BOS happens when price breaks above a previous swing high or below a previous swing low. It signals continuation of the current trend.
Change of Character (CHOCH)
A CHOCH is the first sign that the trend may be reversing. Example:
- In an uptrend, a CHOCH occurs when price breaks a previous swing low.
- In a downtrend, a CHOCH occurs when price breaks a previous swing high.
CHOCH = early warning BOS = confirmation
Prop Firm Tip: Recognizing a CHOCH early prevents you from holding losing positions or buying into exhaustion, protecting your daily loss limit during volatile sessions.
Trend Structure vs Range Structure
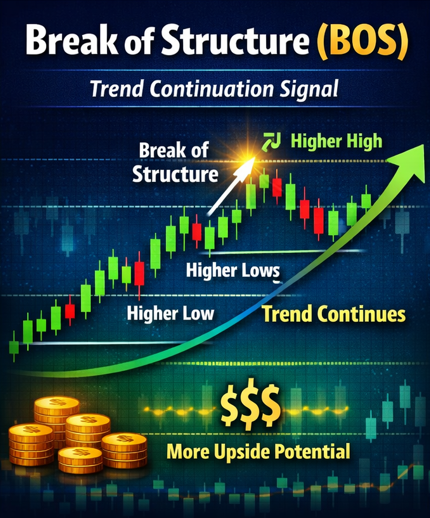
The Moment a Trend Confirms Continuation.
The “Break of Structure (BOS)” chart illustrates how price confirms a trend continuation in forex trading. It shows a series of higher highs and higher lows connected by an ascending trend line.
When price breaks above the previous high, a glowing marker highlights the BOS point — signaling that bullish momentum remains intact.
Trend Structure
A trend is defined by the sequence of highs and lows.
Uptrend:
- Higher highs (HH)
- Higher lows (HL)
Downtrend:
- Lower highs (LH)
- Lower lows (LL)
If the sequence breaks, the trend weakens.
Range Structure
A range forms when price moves sideways between support and resistance.
Characteristics:
- No clear HH/HL or LH/LL pattern
- Liquidity builds above equal highs and below equal lows
- Breakouts often target these liquidity pools
Ranges are where institutions accumulate or distribute positions.
Liquidity Zones and Why Price Targets Them
Liquidity is fuel for the market. Price moves toward liquidity because that’s where large orders can be filled.
Key Liquidity Areas
- Equal highs → liquidity above
- Equal lows → liquidity below
- Stop loss clusters
- Imbalance zones (FVGs)
- Order blocks
Why this matters for funded traders: If you trade prop firm challenges (FTMO, FundedNext, FundingPips, The5ers), entering breakouts blindly without mapping liquidity pools will expose you to classic institutional “stop hunts.” Spotting these sweeps keeps your drawdown safe.
Why price hunts liquidity
Institutions need liquidity to execute large positions. They push price into areas where retail traders place stops — then reverse.
This is why “stop hunts” happen before major moves.
How Smart Money Uses Market Structure
Smart money (institutions) uses market structure to:
- Accumulate positions in ranges
- Manipulate price into liquidity
- Break structure to confirm direction
- Enter at premium/discount zones
Premium vs Discount Zones
In an uptrend:
- Discount zone = good for buys
- Premium zone = good for sells (countertrend)
In a downtrend:
- Premium zone = good for sells
- Discount zone = good for buys (countertrend)
These zones are created using tools like Fibonacci or simple swing analysis.
Practical Examples for Beginners
Practical Application for Traders
- Start on Higher Timeframes (HTF): Always map structure on the 4-Hour or Daily chart first for directional bias.
- Wait for Confirmation: Never enter a trade mid-range; wait for a BOS (continuation) or CHOCH (reversal) to confirm your thesis.
- Align with Your Rules: Ensure your strategy respects the max drawdown and consistency guidelines of your chosen trading program.
Example 1: Uptrend
- Price forms HL → HH → HL → HH
- A BOS confirms continuation
- A CHOCH signals the first sign of reversal
- A break of the last HL confirms the trend is over
Example 2: Range
- Price bounces between support and resistance
- Liquidity builds above equal highs
- Price sweeps the highs
- Then reverses and breaks structure
This is a classic accumulation/distribution pattern.
Common Mistakes Traders Make
- Trading without identifying the trend
- Entering before structure confirms direction
- Ignoring liquidity zones
- Using indicators without understanding price
- Confusing CHOCH with BOS
- Trading inside messy ranges
Market structure removes confusion — it gives you a clean framework.
Why Market Structure Matters for Prop Firm Traders
Many traders fail funded-account evaluations because they enter trades based on emotions, indicators, or market noise instead of objective market structure.
Understanding market structure helps traders identify trend direction, avoid low-probability setups, and make decisions based on price behaviour rather than assumptions. This creates a more consistent approach to trading and can reduce unnecessary drawdown.
Prop firms reward traders who demonstrate discipline and repeatable execution. By waiting for valid Breaks of Structure (BOS), recognizing Changes of Character (CHOCH), and respecting liquidity zones, traders can improve decision-making while remaining aligned with professional risk-management practices.
Market structure provides the framework that supports trading plans, risk management, and long-term consistency – all of which are essential skills for funded trading success.
Market Structure Checklist for Prop Firm Traders
Before entering a trade, confirm the following:
- Have I identified the current market structure?
- Is the market trending or ranging?
- Has a valid BOS or CHOCH occurred?
- Am I trading with the prevailing market direction?
- Have I identified nearby liquidity zones?
- Does the setup comply with my risk-management rules?
- Does the trade fit my trading plan?
Following a structured process can help traders avoid impulsive decisions and maintain consistency throughout an evaluation programme.
Final Tips for Reading Market Structure
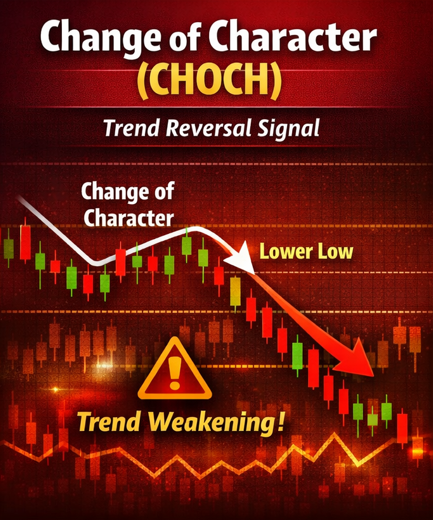
The “Change of Character (CHOCH)
The “Change of Character (CHOCH)” chart visualises how price signals a potential trend reversal in forex trading. It shows a transition from an uptrend to a downtrend, marked by a decisive break below a previous low.
knowing this will help you understand the Forex Market Structure.
- Start on higher timeframes (HTF gives clarity)
- Mark major swing highs and lows
- Identify the current trend or range
- Look for liquidity pools
- Wait for CHOCH or BOS before entering
- Never trade against structure without a reason
Master market structure, and every strategy becomes clearer.
Put Market Structure to the Test
Before risking capital on a live evaluation, make sure your strategy matches your risk profile and trading style.
🚀 Ready to Take the Next Step?
- Find Your Provider: Take our free Prop Firm Match Assessment to see which funded account provider fits your trading style.
- Explore Resources: Access calculators and reviews in the Forex Decision Hub.